Infographics are one of the most powerful tools you can use to present information online. If you want a smart way to tell stories that keeps people engaged and offers information in a visual and easily digestible way, infographics are a smart choice.
Almost anyone can put together a simple infographic, with plenty of simply tools that make it easier. However, if you want to create engaging infographics that go above and beyond the basic, you need to have the right tools. Fortunately, there are a number of excellent tools that allow you to create incredible infographics that can’t be beaten.
Take your online marketing to the next level with our affordable SEO services contact the WebsitePromoter team today.
Take a look at these top three tools for creating infographics.
Piktochart
Just because you want to be able to easily create infographics, it doesn’t mean that you want them to be simple. If you’re looking for an infographic tool that’s easy to use but still offers a range of features, Piktochart is a good choice.
It also offers the option to make presentations, reports and more, but it’s especially good for infographics. It has lots of tips integrated into its templates and a great quality photo library, as well as a user-friendly interface.

Infogram
If you’re going to make something that’s visually appealing, it makes sense that you have a visually appealing tool to do it.
The Infogram tool has a great aesthetic and makes it easy to add some great elements. It allows you to create charts using your data and insert them into your infographics for a great way to present data. It’s also integrated with a number of business tools so you can easily insert spreadsheet data.

Venngage

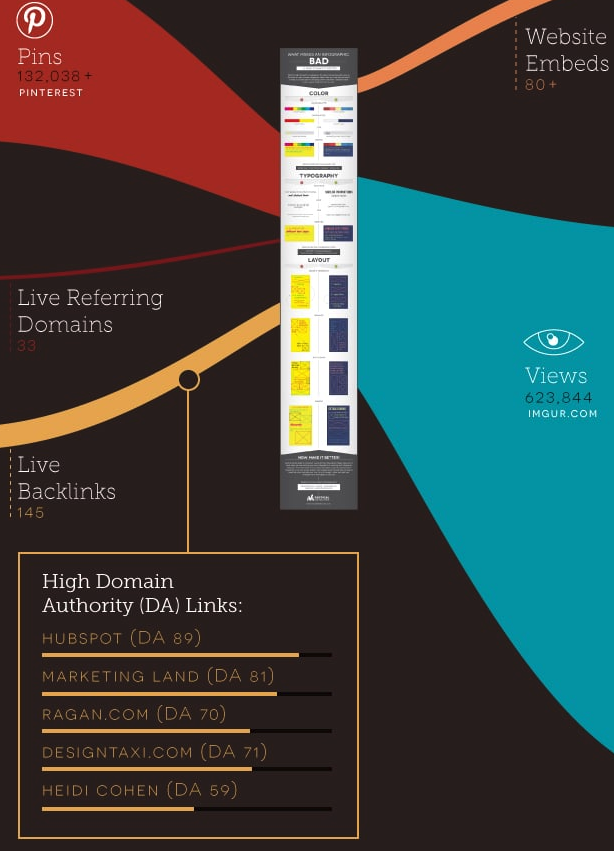
As a highly visual way of engaging people, infographics tend to perform well. Vertical Measures has some case studies showing how effective their use of infographics has been.
They include one infographic about bad infographic design that generated a lot of engagement on social media, including more than 132,000 Pinterest pins and over 600,000 views on Imgur, as well as 145 backlinks.

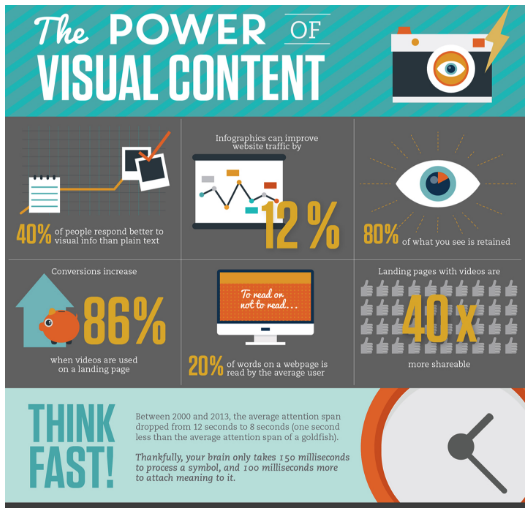
One study showed that infographics can improve website traffic by up to 12%, and 65% of B2B marketers now use infographics, showing one of the largest growths over the last four years.

Digital marketers should all be making sure that they’re not only using infographics but focusing on using them in ways that are most effective. They’re excellent for storytelling and visualizing data, but only when designed well and used properly.
Use these tools to create engaging infographics and use them in various ways to present information in a more digestible manner.

Leave a Reply
You must be logged in to post a comment.